Two population Interval Wise Testing procedure
Source:R/ITP2bspline.R, R/ITP2fourier.R, R/ITP2pafourier.R, and 1 more
IWT2.RdThe function implements the Interval Wise Testing procedure for testing mean differences between two functional populations. Functional data are tested locally and unadjusted and adjusted p-value functions are provided. The unadjusted p-value function controls the point-wise error rate. The adjusted p-value function controls the interval-wise error rate.
Usage
ITP2bspline(
  data1,
  data2,
  mu = 0,
  B = 1000,
  paired = FALSE,
  order = 2,
  nknots = dim(data1)[2]
)

ITP2fourier(
  data1,
  data2,
  mu = 0,
  B = 1000,
  paired = FALSE,
  maxfrequency = floor(dim(data1)[2]/2)
)

ITP2pafourier(
  data1,
  data2,
  mu = 0,
  B = 1000,
  paired = FALSE,
  maxfrequency = floor(dim(data1)[2]/2)
)

iwt2(
  data1,
  data2,
  mu = 0,
  dx = NULL,
  n_perm = 1000L,
  paired = FALSE,
  alternative = c("two.sided", "less", "greater"),
  standardize = FALSE,
  verbose = FALSE,
  aggregation_strategy = c("integral", "max"),
  recycle = TRUE
)

IWT2(
  data1,
  data2,
  mu = 0,
  dx = NULL,
  B = 1000L,
  paired = FALSE,
  alternative = c("two.sided", "less", "greater"),
  statistic = c("Integral", "Max", "Integral_std", "Max_std"),
  verbose = FALSE,
  recycle = TRUE
)
Arguments
- data1
Either a numeric matrix or an object of class
fda::fdspecifying the data in the first sample. If the data is provided within a matrix, it should be of shape \(n_1 \times J\) and it should contain in each row one of the \(n_1\) functions in the sample and in columns the evaluation of each function on a same uniform grid of size \(J\).- data2
Either a numeric matrix or an object of class
fda::fdspecifying the data in the second sample. If the data is provided within a matrix, it should be of shape \(n_2 \times J\) and it should contain in each row one of the \(n_2\) functions in the sample and in columns the evaluation of each function on a same uniform grid of size \(J\).- mu
Either a numeric value or a numeric vector or an object of class
fda::fdspecifying the functional mean difference under the null hypothesis. Ifmuis a constant, then a constant function is used. Ifmuis a numeric vector, it must correspond to evaluation of the mean difference function on the same grid that has been used to evaluate the data samples. Defaults to0.- B
An integer value specifying the number of permutations to use for the local testing procedure. Defaults to
1000L.- paired
A boolean value specifying whether a paired test should be performed. Defaults to
FALSE.- order
Order of the B-spline basis expansion. Defaults to
2L.- nknots
Number of knots of the B-spline basis expansion. Defaults to
dim(data1)[2].- maxfrequency
The maximum frequency to be used in the Fourier basis expansion of data. Defaults to
floor(dim(data1)[2] / 2), leading to an interpolating expansion.- dx
A numeric value specifying the step of the uniform grid on which the data are evaluated. If
NULL, the step is automatically inferred from the data. Defaults toNULL.- n_perm
An integer value specifying the number of permutations to use for the local testing procedure. Defaults to
1000L.- alternative
A string specifying the type of alternative hypothesis. Choices are
"two.sided","less"or"greater". Defaults to"two.sided".- standardize
A boolean value specifying whether to standardize the test statistic. Defaults to
FALSE.- verbose
A boolean value specifying whether to print the progress of the computation. Defaults to
FALSE.- aggregation_strategy
A string specifying the strategy to aggregate the point-wise test statistics for the correction procedure. Possible values are
"integral"and"max". Defaults to"integral".- recycle
A boolean value specifying whether to recycle the test statistic values across permutations for the IWT procedure. Defaults to
TRUE.- statistic
A string specifying the test statistic to use. Possible values are:
"Integral": Integral of the squared sample mean difference."Max": Maximum of the squared sample mean difference."Integral_std": Integral of the squared t-test statistic."Max_std": Maximum of the squared t-test statistic.
Defaults to
"Integral".
Value
An object of class fts containing the following components:
data: A numeric matrix of shape \(n \times J\) containing the evaluation of the \(n = n_1 + n_2\) functions on a common uniform grid of size \(p\).group_labels: An integer vector of size \(n = n_1 + n_2\) containing the group membership of each function.mu: A numeric vector of shape \(J\) containing the evaluation of the functional mean difference under the null hypothesis on the same uniform grid used to evaluate the functional samples.unadjusted_pvalues: A numeric vector of size \(J\) containing the evaluation of the unadjusted p-value function on the same uniform grid used to evaluate the functional samples.adjusted_pvalues: A numeric vector of size \(J\) containing the evaluation of the adjusted p-value functione on the same uniform grid used to evaluate the functional samples.correction_method: A string containing the correction method used to compute the adjusted p-value function.
Optionally, the list may contain the following components:
global_pvalue: A numeric value containing the global p-value. Only present if thecorrectionargument is set to"Global".pvalue_matrix: A numeric matrix of shape \(p \times p\) containing the p-values of the interval-wise tests. Element \(i, j\) contains the p-value of the test performed on the interval indexed by \(j, j+1 , \dots, j+(p-i)\). Only present if thecorrectionargument is set to"IWT".
References
Pini, Alessia, and Simone Vantini. 2016. “The interval testing procedure: a general framework for inference in functional data analysis.” Biometrics 72 (3): 835–845.
Pini, Alessia, and Simone Vantini. 2017. “Interval-Wise Testing for Functional Data.” Journal of Nonparametric Statistics 29 (2): 407–24.
Pini, Alessia, Simone Vantini, Bianca Maria Colosimo, and Marco Grasso. 2018. “Domain-Selective Functional Analysis of Variance for Supervised Statistical Profile Monitoring of Signal Data.” Journal of the Royal Statistical Society Series C: Applied Statistics 67 (1): 55–81.
Abramowicz, Konrad, Charlotte K Häger, Alessia Pini, Lina Schelin, Sara Sjöstedt de Luna, and Simone Vantini. 2018. “Nonparametric Inference for Functional-on-Scalar Linear Models Applied to Knee Kinematic Hop Data After Injury of the Anterior Cruciate Ligament.” Scandinavian Journal of Statistics 45 (4): 1036–61.
See also
global2(), twt2(), pct2(), fdr2() for calling directly
one of the other tests, functional_two_sample_test() for calling the
interface test and plot.fts() for plotting the results.
Examples
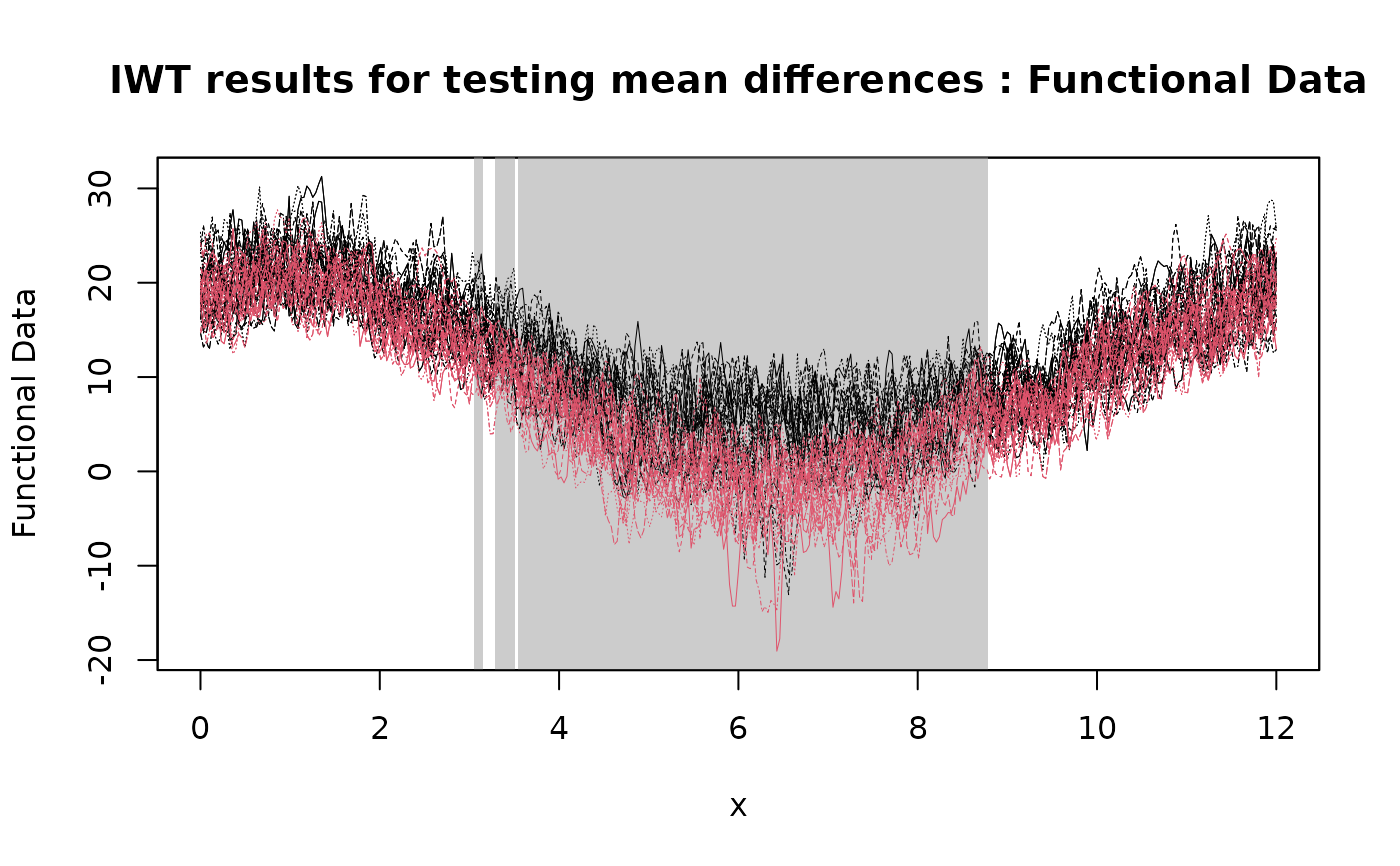
# Performing the IWT for two populations
IWT_result <- iwt2(NASAtemp$paris, NASAtemp$milan, n_perm = 10L)
# Plotting the results of the IWT
plot(
IWT_result,
xrange = c(0, 12),
title = "IWT results for testing mean differences"
)
 # Plotting the p-value heatmap
IWTimage(IWT_result, abscissa_range = c(0, 12))
# Plotting the p-value heatmap
IWTimage(IWT_result, abscissa_range = c(0, 12))
 # Selecting the significant components at 5% level
which(IWT_result$adjusted_pvalues < 0.05)
#> [1] 87 88 89 90 91 92 93 94 95 96 97 98 99 100 101 102 103 104
#> [19] 105 106 107 108 109 110 111 112 113 114 115 116 117 118 119 120 121 122
#> [37] 123 124 125 126 127 128 129 130 131 132 133 134 135 136 137 138 139 140
#> [55] 141 142 143 144 145 146 147 148 149 150 151 152 153 154 155 156 157 158
#> [73] 159 160 161 162 163 164 165 166 167 168 169 170 171 172 173 174 175 176
#> [91] 177 178 179 180 181 182 183 184 185 186 187 188 189 190 191 192 193 194
#> [109] 195 196 197 198 199 200 201 202 203 204 205 206 207 208 209 210 211 212
#> [127] 213 214 215 216 217 218 219 220 221 222 223 224 225 226 227 228 229 230
#> [145] 231 232 233 234 235 236 237 238 239 240 241 242 243 244 245 246 247 248
#> [163] 249 254 255 256 257 258 259 260 261 262 263 264 265 266 267 268 269 270
#> [181] 271 272 273 274 275 276 277 281 282 283 284 285
# Selecting the significant components at 5% level
which(IWT_result$adjusted_pvalues < 0.05)
#> [1] 87 88 89 90 91 92 93 94 95 96 97 98 99 100 101 102 103 104
#> [19] 105 106 107 108 109 110 111 112 113 114 115 116 117 118 119 120 121 122
#> [37] 123 124 125 126 127 128 129 130 131 132 133 134 135 136 137 138 139 140
#> [55] 141 142 143 144 145 146 147 148 149 150 151 152 153 154 155 156 157 158
#> [73] 159 160 161 162 163 164 165 166 167 168 169 170 171 172 173 174 175 176
#> [91] 177 178 179 180 181 182 183 184 185 186 187 188 189 190 191 192 193 194
#> [109] 195 196 197 198 199 200 201 202 203 204 205 206 207 208 209 210 211 212
#> [127] 213 214 215 216 217 218 219 220 221 222 223 224 225 226 227 228 229 230
#> [145] 231 232 233 234 235 236 237 238 239 240 241 242 243 244 245 246 247 248
#> [163] 249 254 255 256 257 258 259 260 261 262 263 264 265 266 267 268 269 270
#> [181] 271 272 273 274 275 276 277 281 282 283 284 285