Two population functional Benjamini-Hochberg procedure
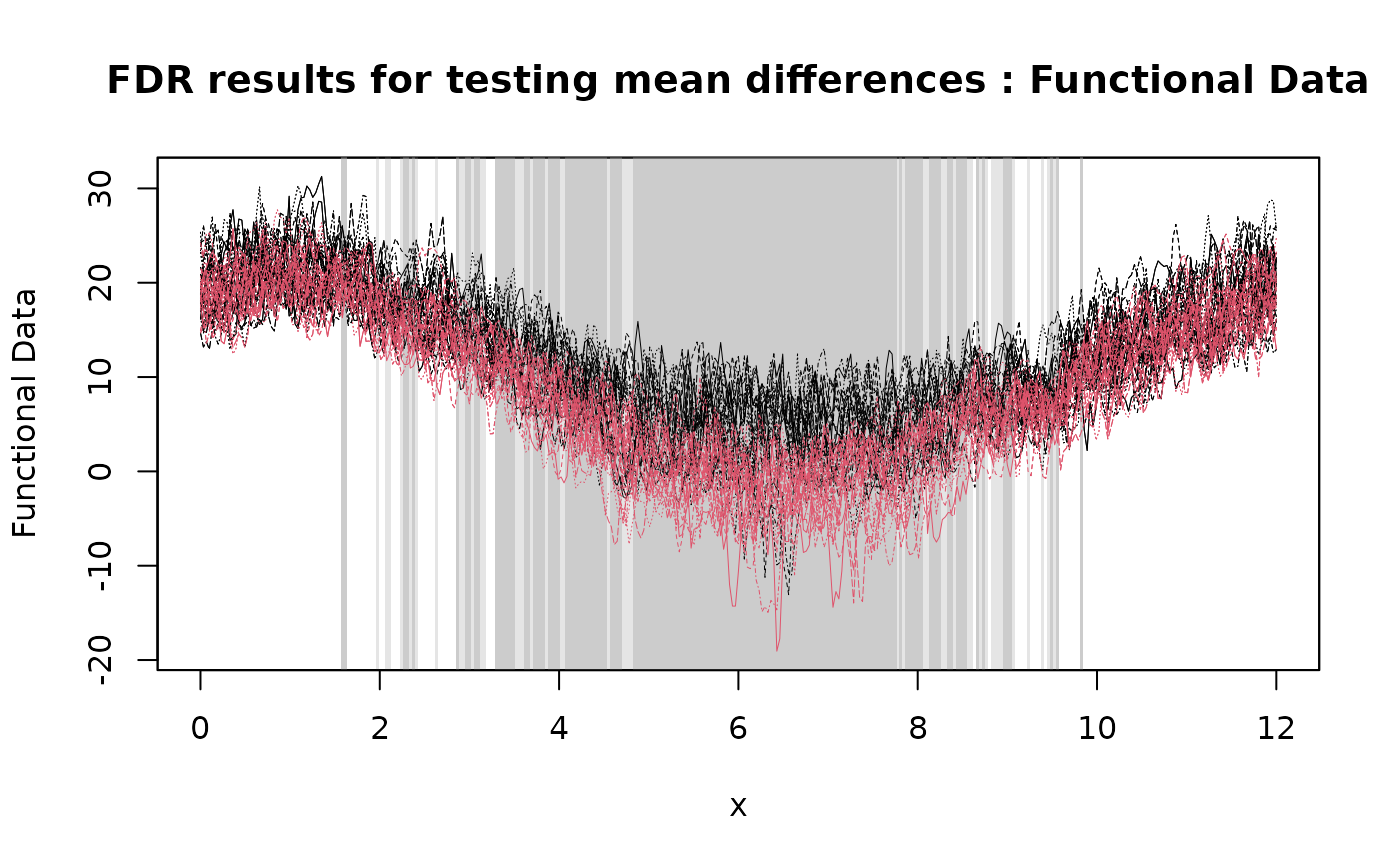
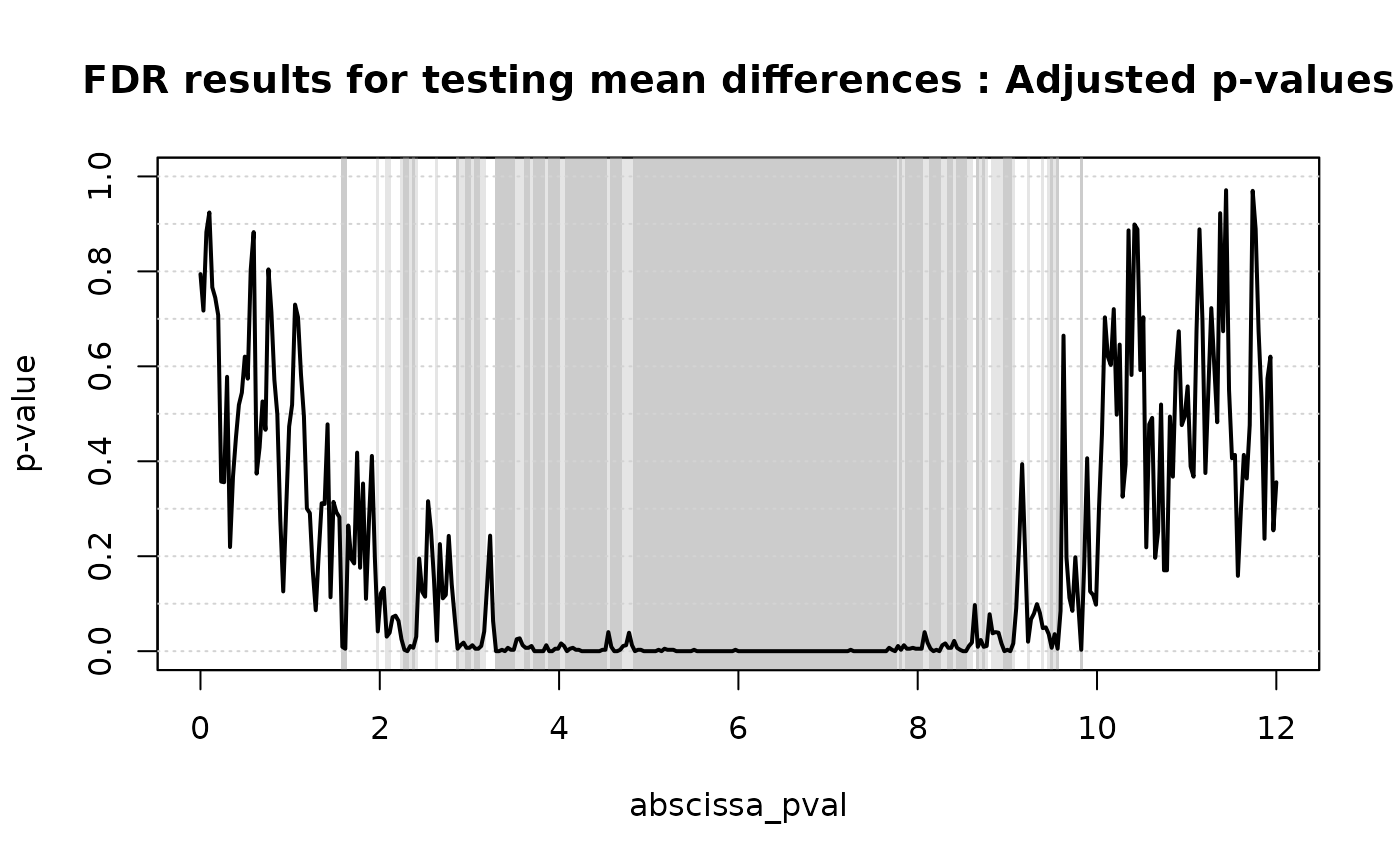
FDR2.RdThe function implements the functional Benjamini Hochberg (fBH) procedure for testing mean differences between two functional populations. Functional data are tested locally and unadjusted and adjusted p-value functions are provided. The unadjusted p-value function controls the point-wise error rate. The adjusted p-value function controls the family-wise error rate asymptotically.
Arguments
- data1
First population's data. Either pointwise evaluations of the functional data set on a uniform grid, or a
fdobject from the packagefda. If pointwise evaluations are provided,data2is a matrix of dimensionsc(n1,J), withJevaluations on columns andn1units on rows.- data2
Second population's data. Either pointwise evaluations of the functional data set on a uniform grid, or a
fdobject from the packagefda. If pointwise evaluations are provided,data2is a matrix of dimensionsc(n1,J), withJevaluations on columns andn2units on rows.- mu
Functional mean difference under the null hypothesis. Three possibilities are available for
mu: a constant (in this case, a constant function is used); aJ-dimensional vector containing the evaluations on the same grid whichdataare evaluated; afdobject from the packagefdacontaining one function. The default ismu=0.- B
The number of iterations of the MC algorithm to evaluate the p-values of the permutation tests. The defualt is
B=1000.- paired
A logical indicating whether a paired test has to be performed. Default is
FALSE.- dx
Used only if a
fdobject is provided. In this case,dxis the size of the discretization step of the grid used to evaluate functional data. If set toNULL, a grid of size 100 is used. Default isNULL.- alternative
A character string specifying the alternative hypothesis, must be one of "
two.sided" (default), "greater" or "less".
Value
An object of class fdatest2 containing the following components:
test: String vector indicating the type of test performed. In this case equal to"2pop".mu: Evaluation on a grid of the functional mean difference under the null hypothesis (as entered by the user).unadjusted_pval: Evaluation on a grid of the unadjusted p-value function.adjusted_pval: Evaluation on a grid of the adjusted p-value function.data.eval: Evaluation on a grid of the functional data.ord_labels: Vector of labels indicating the group membership ofdata.eval.
References
Lundtorp Olsen, N., Pini, A., & Vantini, S. (2021). False discovery rate for functional data TEST 30, 784–809.
See also
See also plot.fdatest2 for plotting the results.
Examples
# Importing the NASA temperatures data set
data(NASAtemp)

# Performing the fBH for two populations

FDR.result <- FDR2(NASAtemp$paris, NASAtemp$milan)

# Plotting the results of the fBH
plot(
  FDR.result,
  xrange = c(0, 12),
  main = 'FDR results for testing mean differences'
)


# Selecting the significant components at 5% level
which(FDR.result$adjusted_pval < 0.05)
#>   [1]  49  50  61  64  65  69  70  71  72  73  74  81  88  89  90  91  92  93
#>  [19]  94  95  96  97 101 102 103 104 105 106 107 108 109 110 111 112 113 114
#>  [37] 115 116 117 118 119 120 121 122 123 124 125 126 127 128 129 130 131 132
#>  [55] 133 134 135 136 137 138 139 140 141 142 143 144 145 146 147 148 149 150
#>  [73] 151 152 153 154 155 156 157 158 159 160 161 162 163 164 165 166 167 168
#>  [91] 169 170 171 172 173 174 175 176 177 178 179 180 181 182 183 184 185 186
#> [109] 187 188 189 190 191 192 193 194 195 196 197 198 199 200 201 202 203 204
#> [127] 205 206 207 208 209 210 211 212 213 214 215 216 217 218 219 220 221 222
#> [145] 223 224 225 226 227 228 229 230 231 232 233 234 235 236 237 238 239 240
#> [163] 241 242 243 244 245 246 247 248 249 250 251 252 253 254 255 256 257 258
#> [181] 259 260 261 262 264 265 266 267 269 270 271 272 273 274 275 276 281 286
#> [199] 288 289 290 291 299