Global testing procedure for testing functional-on-scalar linear models
Source:R/lm-global.R
Globallm.RdThe function is used to fit and test functional linear models. It can be used to carry out regression, and analysis of variance. It implements the global testing procedure for testing the significance of the effects of scalar covariates on a functional population.
Arguments
- formula
An object of class
stats::formula(or one that can be coerced to that class) specifying the model to be fitted in a symbolic fashion. The response (left-hand side) can be either a matrix of dimension \(n \times J\) containing the pointwise evaluations of \(n\) functions on the same grid of \(J\) points, or an object of classfda::fd.- dx
A numeric value specifying the discretization step of the grid used to evaluate functional data when it is provided as objects of class
fda::fd. Defaults toNULL, in which case a default value of0.01is used which corresponds to a grid of size100L. Unused if functional data is provided in the form of matrices.- B
An integer value specifying the number of permutations used to evaluate the p-values of the permutation tests. Defaults to
1000L. Passed asn_perminiwt_aov(),twt_aov()andglobal_aov().- method
A string specifying the permutation scheme.
"residuals"permutes residuals under the reduced model (Freedman-Lane scheme);"responses"permutes the responses (Manly scheme). Defaults to"residuals".- stat
A string specifying the test statistic used for the global test.
"Integral"uses the integral of the F-statistic over the domain;"Max"uses the maximum. Defaults to"Integral".- n_perm
An integer value specifying the number of permutations for the permutation tests. Defaults to
1000L.
Value
An object of class flm containing the following components:
call: The matched call.design_matrix: The design matrix of the functional-on-scalar linear model.unadjusted_pval_F: A numeric vector of length \(J\) containing the unadjusted p-value function of the global F-test evaluated on the grid.adjusted_pval_F: A numeric vector of length \(J\) containing the adjusted p-value function of the global F-test evaluated on the grid.unadjusted_pval_part: A numeric matrix with one row per model term containing the unadjusted p-value functions of the per-term t-tests.adjusted_pval_part: A numeric matrix with one row per model term containing the adjusted p-value functions of the per-term t-tests.data_eval: A numeric matrix containing the functional response evaluated on the grid.coeff_regr_eval: A numeric matrix containing the functional regression coefficients evaluated on the grid.fitted_eval: A numeric matrix containing the fitted values of the functional regression evaluated on the grid.residuals_eval: A numeric matrix containing the residuals of the functional regression evaluated on the grid.R2_eval: A numeric vector containing the functional R-squared evaluated on the grid.
Optionally, the list may contain the following components:
pval_matrix_F: A matrix of dimensions \(p \times p\) of p-values of the interval-wise F-tests. Element \((i,j)\) contains the p-value of the test on the interval \((j, j+1, \ldots, j+(p-i))\). Present only ifcorrectionis"IWT".pval_matrix_part: An array of dimensions \((L+1) \times p \times p\) of p-values of the per-term interval-wise t-tests. Element \((l,i,j)\) contains the p-value of the joint test on term \(l\) and interval \((j, j+1, \ldots, j+(p-i))\). Present only ifcorrectionis"IWT".global_pval_F: Global p-value of the overall F-test. Present only ifcorrectionis"Global".global_pval_part: A numeric vector of global p-values of the per-term t-tests. Present only ifcorrectionis"Global".
References
Abramowicz, K., Pini, A., Schelin, L., Stamm, A., & Vantini, S. (2022). “Domain selection and familywise error rate for functional data: A unified framework. Biometrics 79(2), 1119-1132.
D. Freedman and D. Lane (1983). A Nonstochastic Interpretation of Reported Significance Levels. Journal of Business & Economic Statistics 1(4), 292-298.
B. F. J. Manly (2006). Randomization, Bootstrap and Monte Carlo Methods in Biology. Vol. 70. CRC Press.
See also
iwt_lm(), twt_lm() and global_lm() for calling a
specific correction directly. plot.flm() for plotting the results and
summary.flm() for summarizing the results.
Examples
# Defining the covariates
temperature <- rbind(NASAtemp$milan, NASAtemp$paris)
groups <- c(rep(0, 22), rep(1, 22))
# Performing the Global test
Global_result <- Globallm(temperature ~ groups, B = 1000)
#>
#> ── Point-wise tests ────────────────────────────────────────────────────────────
#>
#> ── Global test ─────────────────────────────────────────────────────────────────
#>
#> ── Global Testing completed ────────────────────────────────────────────────────
# Summary of the Global test results
summary(Global_result)
#> $call
#> functional_lm_test(formula = formula, correction = "Global",
#> dx = dx, B = n_perm, method = method, stat = stat)
#>
#> $ttest
#> Minimum p-value
#> (Intercept) 0 ***
#> groups 0 ***
#>
#> $R2
#> Range of functional R-squared
#> Min R-squared 3.390203e-05
#> Max R-squared 5.399620e-01
#>
#> $ftest
#> Minimum p-value
#> 1 0 ***
#>
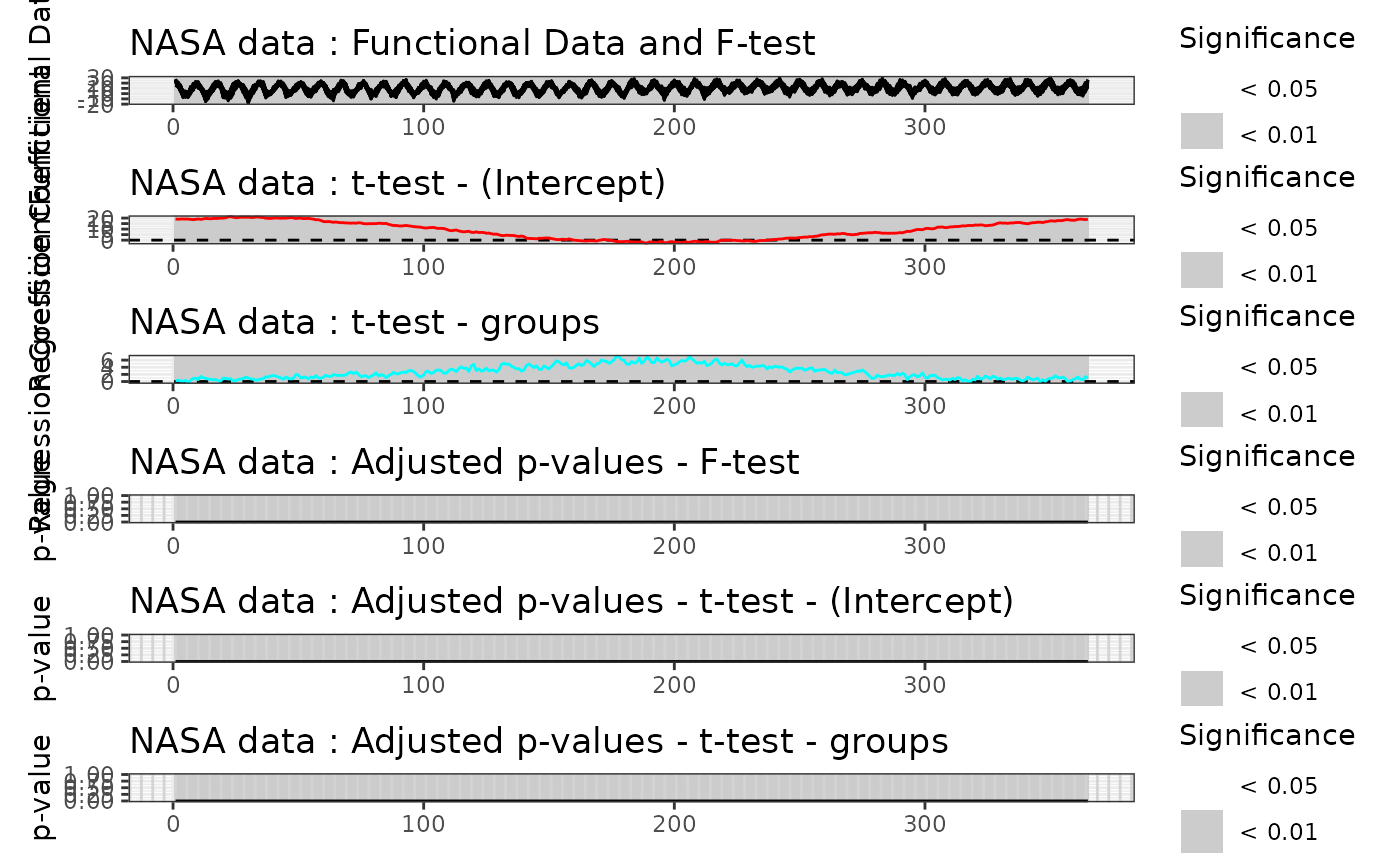
# Plot of the Global test results
plot(
Global_result,
main = "NASA data",
plot_adjpval = TRUE,
xlab = "Day",
xrange = c(1, 365)
)